How does changing MCCE's parameters change accuracy? (under construction)
MCCE offers a wide range of customizable parameter that influence the accuracy of its pKa predictions. Some major options include various internal/external dielectric constants, numerical Poisson-Boltzmann solvers, Van der Waal functions, and water molecule retention/removal. Each of these options or combinatoric assortments of these options can significantly impact MCCE's free energy model, and in turn, affects its pKa predictions. In this study, we systematically evaluate how these parameter choices affect MCCE's calculated pKa values against experimental benchmark values.
Here, we use a set of 36 PDB files sourced from RCSB.org, listed HERE. These PDB files were chosen for their varying sizes, as well as the amount of experimental data available for their residue pKa values. You can find the sources for the experimental pKas in this file: pkdbv1_WT_pkas.csv (change this later to be a citation probably)
Accuracy Criteria
Our benchmark dataset consists of 36 PDB files comprising a total of 1,587 residues, of which 425 have experimentally verified pKa values. These serve as the reference for evaluating the accuracy of MCCE’s pKa predictions. To perform this evaluation, we developed an in-house program that runs parallel MCCE simulations across the 36 structures and compares the predicted pKa values to the experimental values.
We define pKa Accuracy as the percentage of predicted pKa values that fall within ±1 unit of the corresponding experimental values. Additionally, we report the root-mean-square deviation (RMSD), noting that it is sensitive to outliers; where appropriate, we assess how removing outliers affects this metric.
The data presented below were generated using the NGPB Poisson–Boltzmann solver with an internal dielectric constant of 8 and our modified, unscaled van der Waals function. Under these conditions, we observed a pKa Accuracy of 82.35% and an RMSD of 0.88.
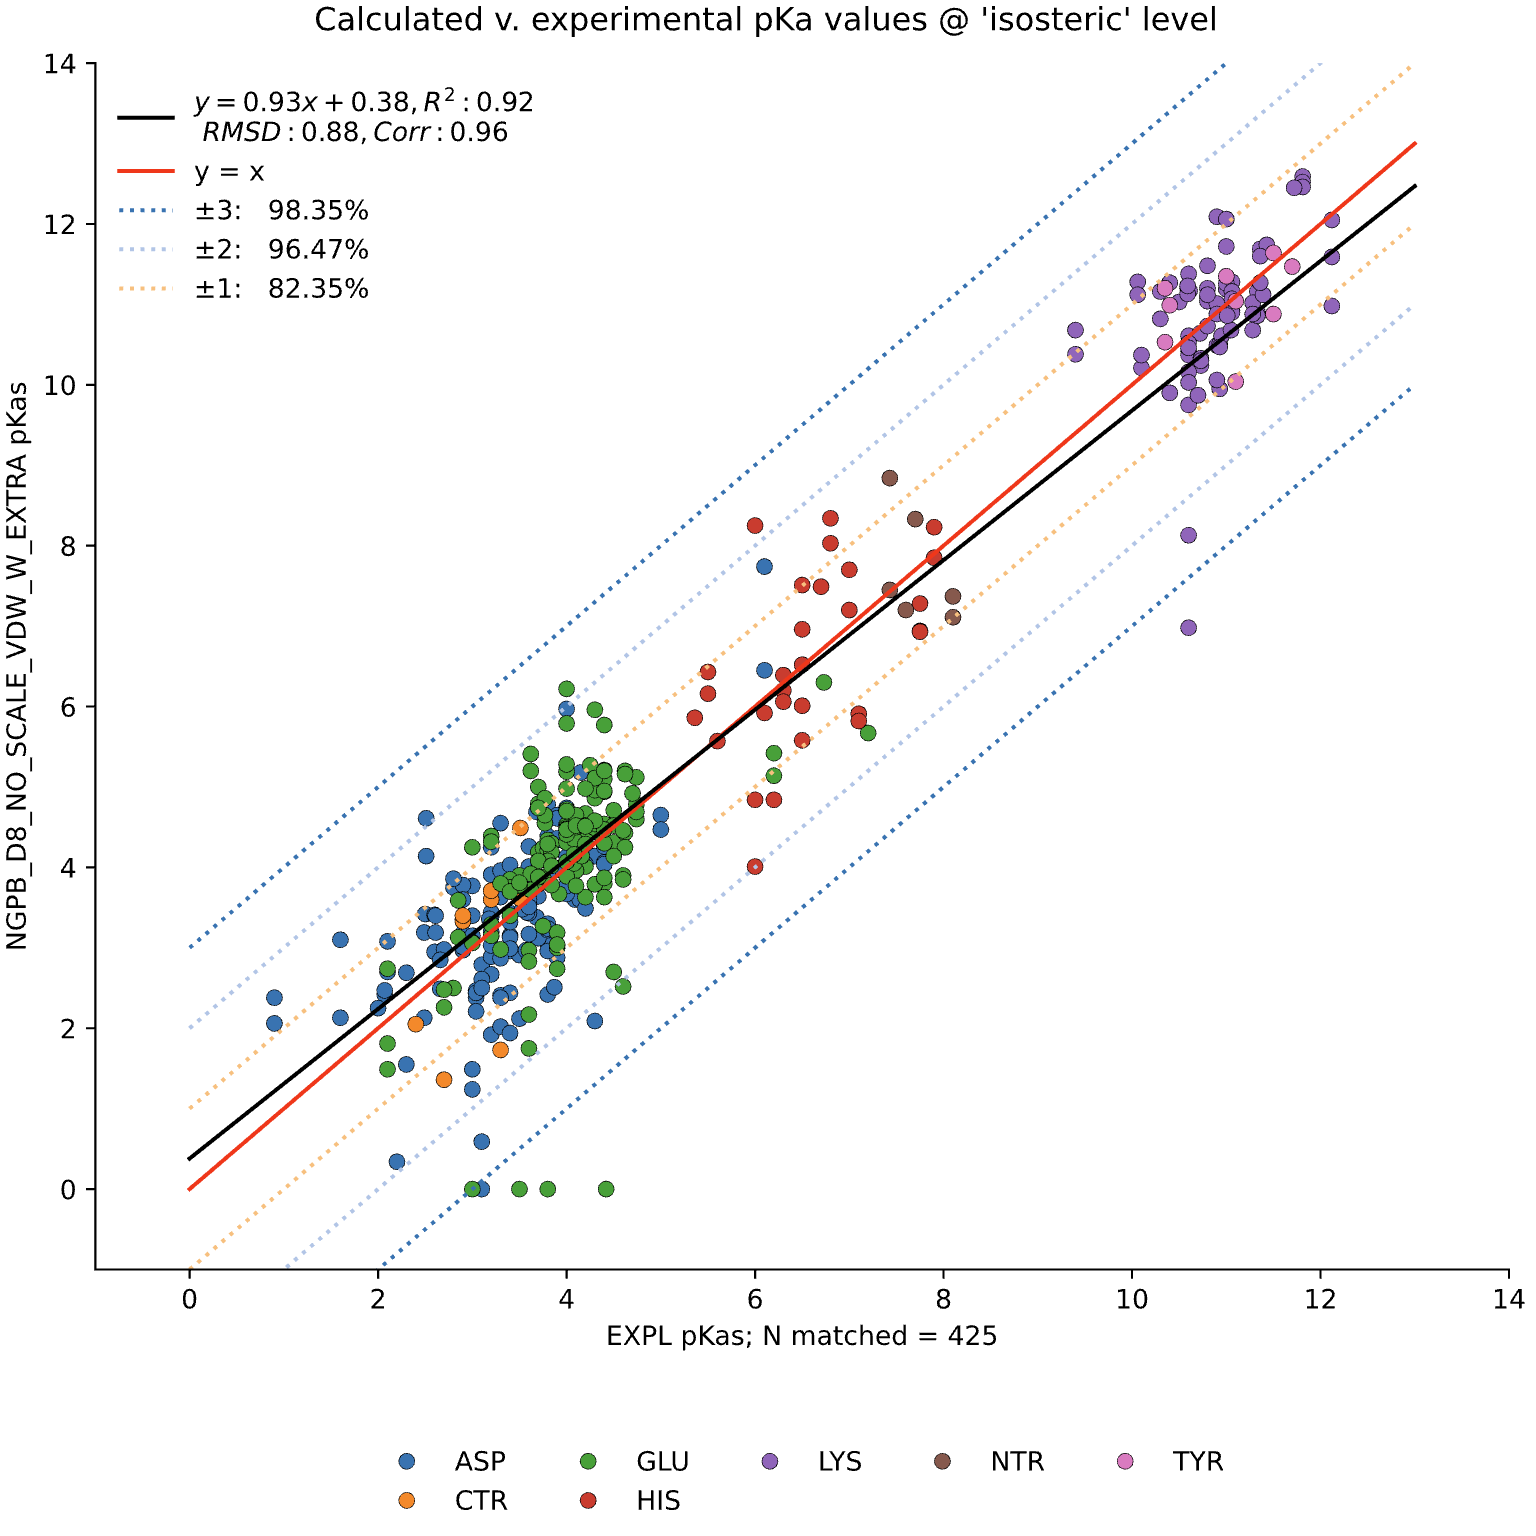
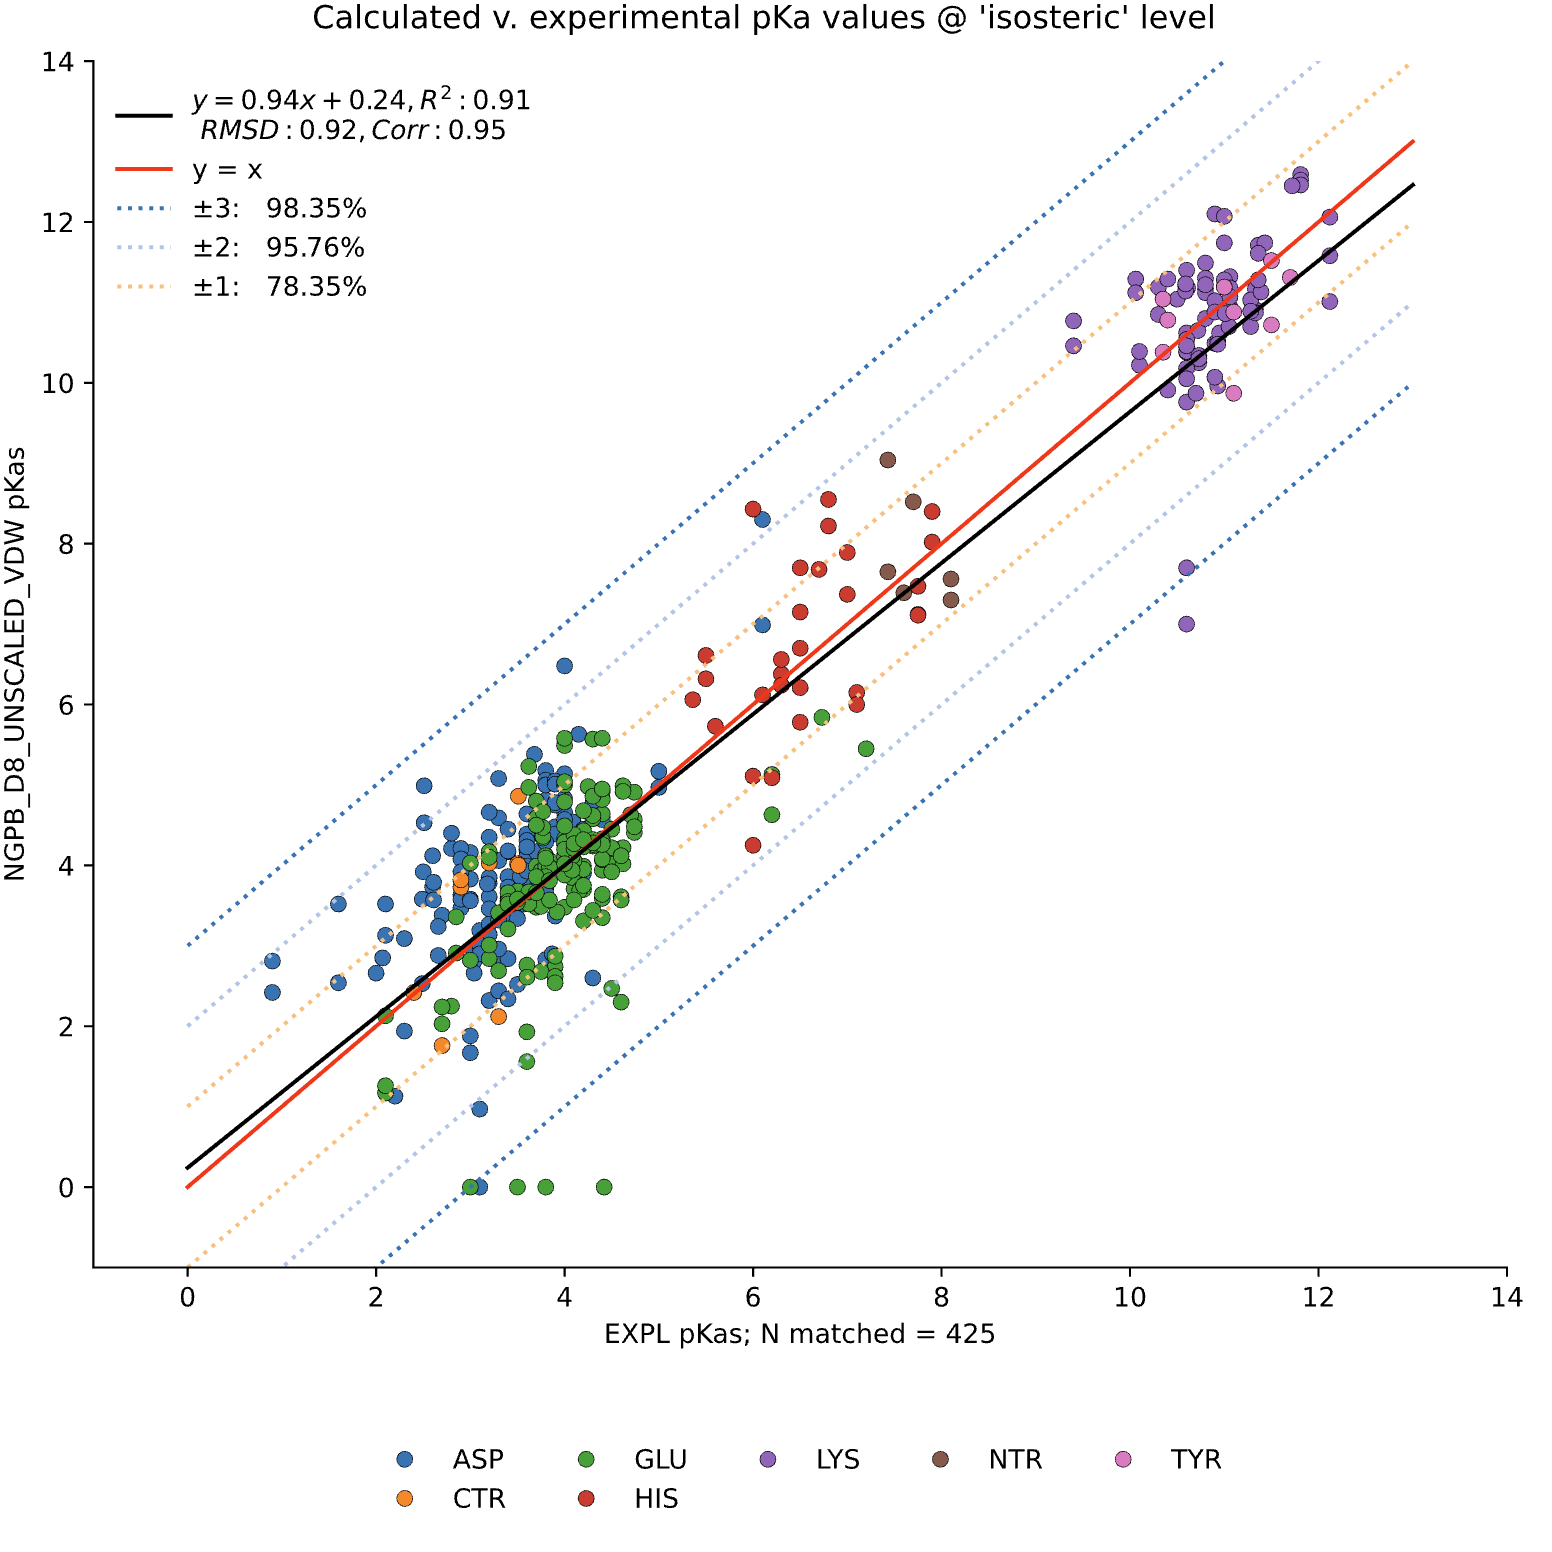
For example, this graph depicts the experimental pKas on the X axis, and MCCE's projected pKas on the Y axis. This run also includes extra values- after the initial pKa calculations are done, all pKas can be moved up or down according to their residue type, by the extra values, to reduce bias (of course, changing the extra values of a residue will not fix the variance of the residue group relative to its experimental values). For comparison's sake, here is another graph of the same dataset, without the extra values:
Poisson-Boltzmann Solvers
Step 3 of MCCE involves solving the Poisson-Boltzmann equation. MCCE4 is currently capable of switching between three different PB solvers: ZAP, Delphi, both sourced from OpenEye, and NGPB, created in house by partners in conjunction with Gunner Lab.
(include RMSD w and w/o outliers)
Dielectric Constant
The variance of MCCE's output is very noticeable for different assumed dielectric constants D. Below, we look at the optimized versions of two NGPB runs, the left assuming D = 4, and the right assuming D = 8. Both runs are dry, and use unscaled VDWs in their calculations.
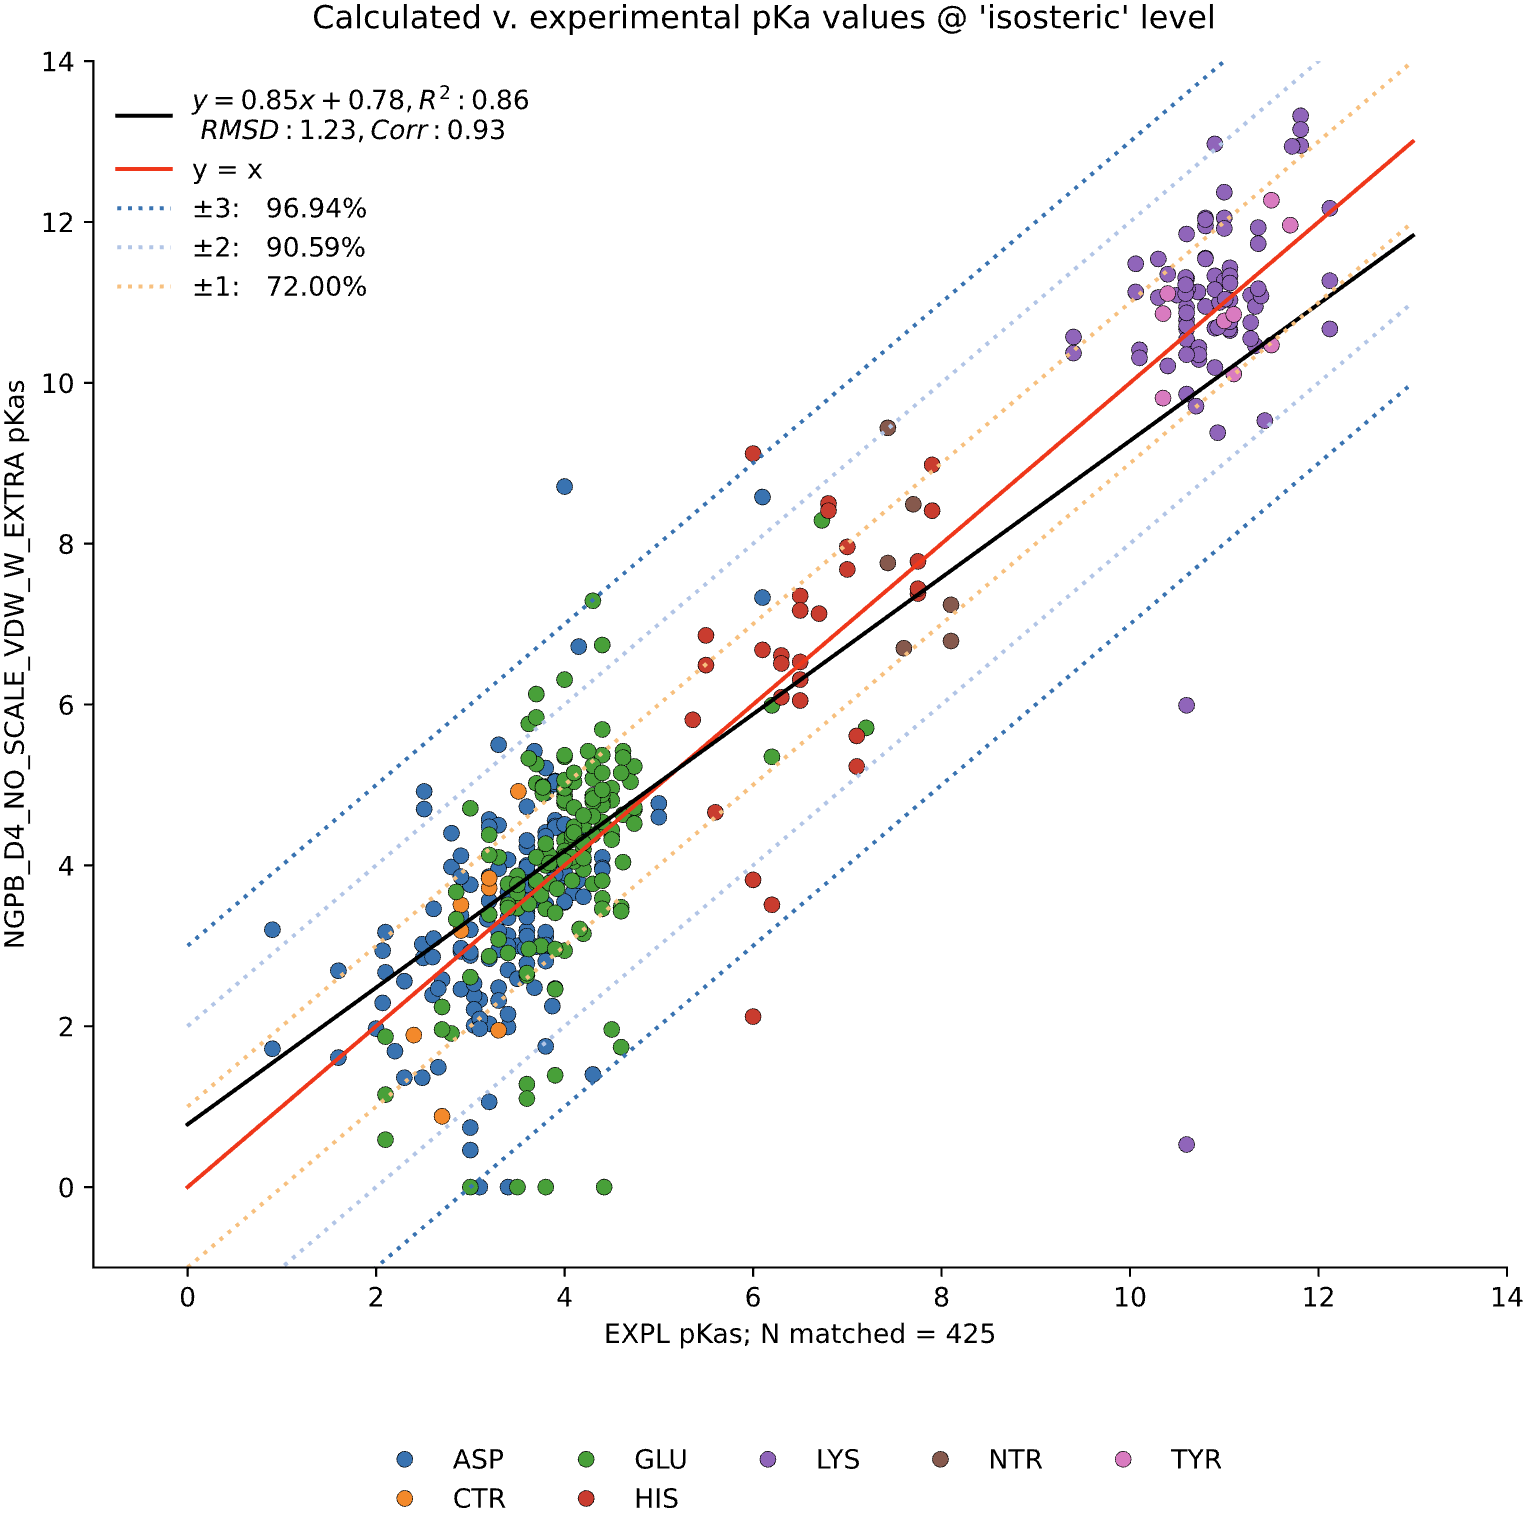

We see similar shapes for the different residue groups in both images, but the of both are
Wet/Dry Runs
We observed little change in accuracy resulting from the presence of waters in a PDB file.